1988 Wirral Metropolitan Borough Council election
|
|
22 of 66 seats (One Third)
to Wirral Metropolitan Borough Council
34 seats needed for a majority |
|---|
| Turnout | 44.5% ( 4.3%)[1] 4.3%)[1] |
|---|
| |
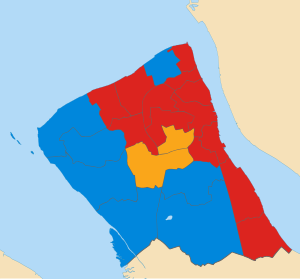 Map of results of 1988 election |
Leader of the Council before election
None
No Overall Control | Leader of the Council after election
None
No Overall Control | |
The 1988 Wirral Metropolitan Borough Council election took place on 5 May 1988 to elect members of Wirral Metropolitan Borough Council in England.[2] This election was held on the same day as other local elections.
After the election, the composition of the council was:
| Party | Seats | ± |
| | Labour | 32 |  5 5 |
| | Conservative | 24 | 5 |
| | SLD | 10 |  |
[3]
Election results
Overall election result
Overall result compared with 1987.
| Wirral Metropolitan Borough Council election results, 1988 |
| |
| Party | Candidates | Votes |
| Stood | Elected | Gained | Unseated | Net | % of total | % | No. | Net % |
| | Labour | 22 | 13 | 5 | 0 | 5 | 59.1 | 41.9 | 47,974 | 8.9 |
| | Conservative | 22 | 7 | 0 | 5 | 5 | 31.8 | 41.9 | 47,921 | 0.2 |
| | SLD | 22 | 2 | 1 | 1 | | 9.1 | 13.5 | 15,451 | 8.8 |
| | Green | 18 | 0 | 0 | 0 | | 0.0 | 2.3 | 2,687 | 1.1 |
| | SDP | 2 | 0 | 0 | 0 | | 0.0 | 0.3 | 389 | N/A |
[1][2]
Ward results
Bebington
Bebington | Party | Candidate | Votes | % | ±% |
| | Conservative | Brian Cummings | 3,008 | 54.2 | 1.6 |
| | Labour | A. Witter | 1,909 | 34.4 | 8.3 |
| | SLD | Kevin Turner | 351 | 6.3 | 10.1 |
| | Green | Garnette Bowler | 282 | 5.1 | 3.4 |
| Majority | 1,099 | 19.8 | 9.9 |
| Registered electors | 11,363 | | |
| Turnout | | 48.8 | 6.6 |
| | Conservative hold | Swing | 5.0 | |
[2]
Bidston
Bidston | Party | Candidate | Votes | % | ±% |
| | Labour | J. Williams | 2,815 | 84.9 | 3.0 |
| | Conservative | W. Houldin | 281 | 8.5 | 0.9 |
| | SLD | Stephen Niblock | 141 | 4.3 | 4.4 |
| | Green | Robert Mitchell | 78 | 2.4 | New |
| Majority | 2,534 | 76.4 | 3.9 |
| Registered electors | 9,256 | | |
| Turnout | | 35.8 | 4.5 |
| | Labour hold | Swing | 2.0 | |
[2][4]
Birkenhead
Birkenhead | Party | Candidate | Votes | % | ±% |
| | Labour | William Lungley | 3,035 | 76.5 | 7.0 |
| | Conservative | D. Smith | 501 | 12.6 | 1.0 |
| | SLD | Stuart Kelly | 333 | 8.4 | 10.5 |
| | Green | A. Harrison | 98 | 2.5 | New |
| Majority | 2,534 | 63.9 | 13.3 |
| Registered electors | 11,005 | | |
| Turnout | | 36.0 | 3.2 |
| | Labour hold | Swing | 6.7 | |
[2][5]
Bromborough
Bromborough | Party | Candidate | Votes | % | ±% |
| | Labour | David Jackson | 2,898 | 58.1 | 10.2 |
| | Conservative | C. Molyneux | 1,638 | 32.8 | 5.1 |
| | SLD | Simon Holbrook | 364 | 7.3 | 6.9 |
| | Green | Perle Sheldricks | 87 | 1.7 | New |
| Majority | 1,260 | 25.3 | 15.4 |
| Registered electors | 11,420 | | |
| Turnout | | 43.7 | 5.2 |
| | Labour hold | Swing | 7.7 | |
[2][6]
Clatterbridge
Clatterbridge | Party | Candidate | Votes | % | ±% |
| | Conservative | Michael Moore | 3,851 | 61.5 | 2.5 |
| | Labour | M. Harper | 1,507 | 24.1 | 7.3 |
| | SLD | S. Dutton | 724 | 11.6 | 7.6 |
| | Green | S. Birchenough | 180 | 2.9 | New |
| Majority | 2,344 | 37.4 | 7.3 |
| Registered electors | 14,078 | | |
| Turnout | | 44.5 | 7.2 |
| | Conservative hold | Swing | 3.7 | |
[2]
Claughton
Claughton | Party | Candidate | Votes | % | ±% |
| | Labour | George Davies | 2,210 | 41.1 | 12.5 |
| | Conservative | Ian McKellar | 1,903 | 35.4 | 3.6 |
| | SLD | Anna Blumenthal | 1,114 | 20.7 | 17.0 |
| | Green | Pamela Mitchell | 146 | 2.7 | 0.8 |
| Majority | 307 | 5.7 | N/A |
| Registered electors | 10,877 | | |
| Turnout | | 49.4 | 1.4 |
| | Labour gain from Conservative | Swing | 7.4 | |
[2][7]
Eastham
Eastham | Party | Candidate | Votes | % | ±% |
| | Labour | Andrew Dow | 1,896 | 34.5 | 9.4 |
| | SLD | D. Charles | 1,840 | 33.5 | 7.8 |
| | Conservative | Mary Jordan | 1,647 | 30.0 | 3.6 |
| | Green | Nigel Birchenough | 107 | 1.9 | New |
| Majority | 56 | 1.0 | N/A |
| Registered electors | 11,917 | | |
| Turnout | | 46.1 | 6.7 |
| | Labour gain from SLD | Swing | 4.4 | |
[2][8]
Egerton
Egerton | Party | Candidate | Votes | % | ±% |
| | Labour | Alec Dunn | 3,062 | 66.2 | 13.8 |
| | Conservative | G. Francomb | 1,023 | 22.1 | 4.7 |
| | SLD | K. Hughes | 396 | 8.6 | 10.2 |
| | Green | David Pye | 143 | 3.1 | 1.1 |
| Majority | 2,039 | 44.1 | 18.5 |
| Registered electors | 11,474 | | |
| Turnout | | 40.3 | 3.4 |
| | Labour hold | Swing | 9.3 | |
[2]
Heswall
Heswall | Party | Candidate | Votes | % | ±% |
| | Conservative | M. Banks | 4,349 | 75.8 | 4.3 |
| | Labour | Michael Sullivan | 676 | 11.8 | 6.0 |
| | SLD | Robert Wilkins | 519 | 9.0 | 11.9 |
| | Green | J. Bruce | 195 | 3.4 | 1.7 |
| Majority | 3,673 | 64.0 | 13.4 |
| Registered electors | 13,362 | | |
| Turnout | | 43.0 | 9.1 |
| | Conservative hold | Swing | 6.7 | |
[2][9][10]
Hoylake
Hoylake | Party | Candidate | Votes | % | ±% |
| | Conservative | Frank Jones | 3,891 | 69.7 | 9.5 |
| | Labour | S. Christie | 810 | 14.5 | 7.7 |
| | SLD | S. Welshman | 642 | 11.5 | 2.6 |
| | Green | A. Brett | 242 | 4.3 | 1.4 |
| Majority | 3,081 | 55.2 | 11.1 |
| Registered electors | 12,797 | | |
| Turnout | | 43.6 | 8.4 |
| | Conservative hold | Swing | 5.6 | |
[2]
Leasowe
Leasowe | Party | Candidate | Votes | % | ±% |
| | Labour | Jim Edwards | 2,805 | 69.0 | 8.0 |
| | Conservative | L. Kennedy | 1,100 | 27.0 | 1.3 |
| | SLD | Susanne Uriel | 162 | 4.0 | 6.8 |
| Majority | 1,705 | 42.0 | 9.3 |
| Registered electors | 9,865 | | |
| Turnout | | 41.2 | 0.8 |
| | Labour hold | Swing | 4.7 | |
[2]
Liscard
Liscard | Party | Candidate | Votes | % | ±% |
| | Labour | E. Smith | 3,321 | 53.3 | 13.4 |
| | Conservative | M. Ebbs | 2,461 | 39.5 | 6.3 |
| | SLD | John Uriel | 449 | 7.2 | 7.1 |
| Majority | 860 | 13.8 | N/A |
| Registered electors | 11,677 | | |
| Turnout | | 53.4 | 0.9 |
| | Labour gain from Conservative | Swing | 9.9 | |
[2]
Moreton
Moreton | Party | Candidate | Votes | % | ±% |
| | Labour | John Clark | 2,665 | 53.2 | 10.1 |
| | Conservative | I. Walker | 2,048 | 40.9 | 0.3 |
| | SLD | B. Thomas | 223 | 4.4 | 11.3 |
| | Green | George Bowler | 76 | 1.5 | New |
| Majority | 617 | 12.3 | 10.4 |
| Registered electors | 9,233 | | |
| Turnout | | 54.3 | 0.8 |
| | Labour gain from Conservative | Swing | 5.2 | |
[2]
New Brighton
New Brighton | Party | Candidate | Votes | % | ±% |
| | Labour | Colin Penfold | 2,438 | 44.1 | 11.3 |
| | Conservative | P. Buzzard | 2,404 | 43.5 | 0.2 |
| | SLD | L. Matthew | 337 | 6.1 | 17.5 |
| | SDP | R. Curphey | 224 | 4.1 | New |
| | Green | Allen Burton | 125 | 2.3 | New |
| Majority | 34 | 0.6 | N/A |
| Registered electors | 11,868 | | |
| Turnout | | 46.6 | 0.8 |
| | Labour gain from Conservative | Swing | 5.8 | |
[2]
Oxton
Oxton | Party | Candidate | Votes | % | ±% |
| | SLD | Michael Cooke | 2,060 | 38.2 | 0.9 |
| | Conservative | Leonard Moore | 1,979 | 36.7 | 1.2 |
| | Labour | T. Kelly | 1,251 | 23.2 | 0.2 |
| | Green | A. Tebbs | 102 | 1.9 | 0.4 |
| Majority | 81 | 1.5 | 2.1 |
| Registered electors | 11,550 | | |
| Turnout | | 46.7 | 1.7 |
| | SLD hold | Swing | 1.1 | |
[2]
Prenton
Prenton | Party | Candidate | Votes | % | ±% |
| | SLD | Ray Pullen | 2,432 | 39.9 | 2.3 |
| | Conservative | A. Clement | 2,085 | 34.2 | 2.6 |
| | Labour | T. Collins | 1,452 | 23.9 | 4.6 |
| | Green | D. Pye | 119 | 2.0 | 0.3 |
| Majority | 347 | 5.7 | 0.2 |
| Registered electors | 12,462 | | |
| Turnout | | 48.9 | 6.2 |
| | SLD gain from Conservative | Swing | 0.1 | |
[2]
Royden
Royden | Party | Candidate | Votes | % | ±% |
| | Conservative | Derek Robinson | 3,491 | 64.9 | 6.1 |
| | Labour | D. Hughes | 893 | 16.6 | 5.6 |
| | SLD | Peter Reisdorf | 809 | 15.0 | 1.1 |
| | Green | K. Cuthbertson | 185 | 3.4 | 0.4 |
| Majority | 2,598 | 48.3 | 5.6 |
| Registered electors | 12,790 | | |
| Turnout | | 42.0 | 8.2 |
| | Conservative hold | Swing | 2.8 | |
[2][11]
Seacombe
Seacombe | Party | Candidate | Votes | % | ±% |
| | Labour | P. Clee | 3,841 | 75.9 | 13.8 |
| | Conservative | G. Allen | 887 | 17.5 | 3.9 |
| | SLD | H. Warner | 169 | 3.3 | 13.2 |
| | SDP | J. Williams | 165 | 3.3 | New |
| Majority | 2,954 | 58.4 | 17.7 |
| Registered electors | 11,856 | | |
| Turnout | | 42.7 | 2.3 |
| | Labour hold | Swing | 8.9 | |
[2]
Thurstaston
Thurstaston | Party | Candidate | Votes | % | ±% |
| | Conservative | Sid Dunn | 3,469 | 65.6 | 3.2 |
| | Labour | W. Gamet | 985 | 18.6 | 5.5 |
| | SLD | Charles Wall | 521 | 9.9 | 8.9 |
| | Green | David Burton | 314 | 5.9 | 0.2 |
| Majority | 2,484 | 47.0 | 3.3 |
| Registered electors | 12,653 | | |
| Turnout | | 41.8 | 7.3 |
| | Conservative hold | Swing | 1.7 | |
[2]
Tranmere
Tranmere | Party | Candidate | Votes | % | ±% |
| | Labour | R. Davies | 2,893 | 79.1 | 11.8 |
| | Conservative | R. McGunigall | 494 | 13.5 | 1.0 |
| | SLD | C. Townsend | 176 | 4.8 | 11.7 |
| | Green | C. Rainsford | 95 | 2.6 | 0.9 |
| Majority | 2,399 | 65.6 | 14.8 |
| Registered electors | 10,529 | | |
| Turnout | | 34.7 | 3.8 |
| | Labour hold | Swing | 7.4 | |
[2]
Upton
Upton | Party | Candidate | Votes | % | ±% |
| | Labour | Keith Rimmer | 3,105 | 55.3 | 9.9 |
| | Conservative | Geoffrey Caton | 1,729 | 30.8 | 0.3 |
| | SLD | Elizabeth Brame | 664 | 11.8 | 10.9 |
| | Green | G. Osler | 113 | 2.0 | 0.6 |
| Majority | 1,376 | 24.5 | 9.6 |
| Registered electors | 12,731 | | |
| Turnout | | 44.1 | 6.8 |
| | Labour hold | Swing | 4.8 | |
[2]
Wallasey
Wallasey | Party | Candidate | Votes | % | ±% |
| | Conservative | Kate Wood | 3,682 | 59.3 | 6.6 |
| | Labour | M. Mannin | 1,507 | 24.3 | 7.0 |
| | SLD | Moira Gallagher | 1,025 | 16.5 | 13.4 |
| Majority | 2,175 | 35.0 | 12.2 |
| Registered electors | 12,200 | | |
| Turnout | | 50.9 | 3.6 |
| | Conservative hold | Swing | 6.1 | |
[2][12]
Changes between 1988 and 1990
Notes
• italics denote the sitting councillor • bold denotes the winning candidate
References
Mellows-Facer, Adam (10 May 2006). "Local election 2006". parliament.uk. Retrieved 29 December 2018.
"BBC NEWS VOTE 2003 WIRRAL". BBC News. 1 May 2003. Retrieved 29 December 2018.

 4.3%)[1]

 5
5 


