1988 Harlow District Council election
English local election
| |||||||||||||||||||||||||||||||||||||||||
14 of the 42 seats to Harlow District Council 22 seats needed for a majority | |||||||||||||||||||||||||||||||||||||||||
|---|---|---|---|---|---|---|---|---|---|---|---|---|---|---|---|---|---|---|---|---|---|---|---|---|---|---|---|---|---|---|---|---|---|---|---|---|---|---|---|---|---|
| |||||||||||||||||||||||||||||||||||||||||
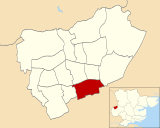
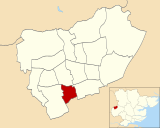
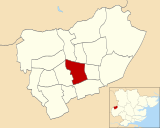
 Map showing the results of contested wards in the 1988 Harlow District Council elections. | |||||||||||||||||||||||||||||||||||||||||
| |||||||||||||||||||||||||||||||||||||||||
The 1988 Harlow District Council election took place on 5 May 1988 to elect members of Harlow District Council in Essex, England. This was on the same day as other local elections. The Labour Party retained control of the council.
Election result
| Party | Seats | Gains | Losses | Net gain/loss | Seats % | Votes % | Votes | +/− | |
|---|---|---|---|---|---|---|---|---|---|
| Labour | 11 | 0 | 1 |  1 1 | 78.6 | 60.1 | 12,227 |  3.4 3.4 | |
| Conservative | 2 | 1 | 0 | 1 | 14.3 | 29.7 | 6,054 | 8.1 | |
| SLD | 1 | 0 | 0 |  | 7.1 | 9.9 | 2,022 | 11.8 | |
| Independent | 0 | 0 | 0 | | 0.0 | 0.3 | 58 | New | |
All comparisons in vote share are to the corresponding 1984 election.
Ward results
Brays Grove

| Party | Candidate | Votes | % | |
|---|---|---|---|---|
| Labour | D. Burnham | 835 | 76.7% | |
| Conservative | D. Messer | 254 | 23.3% | |
| Turnout | 33.8% | |||
| Labour hold | ||||
Great Parndon

| Party | Candidate | Votes | % | |
|---|---|---|---|---|
| Conservative | L. Atkins | 820 | 48.5% | |
| Labour | J. Sanders | 705 | 41.7% | |
| SLD | D. Harris | 106 | 6.3% | |
| Independent | S. Ford | 58 | 3.4% | |
| Turnout | 51.1% | |||
| Conservative hold | ||||
Hare Street and Town Centre

| Party | Candidate | Votes | % | |
|---|---|---|---|---|
| Labour | J. Hobbs | 758 | 75.2% | |
| Conservative | D. Groves | 250 | 24.8% | |
| Turnout | 35.6% | |||
| Labour hold | ||||
Kingsmoor

| Party | Candidate | Votes | % | |
|---|---|---|---|---|
| Conservative | S. Rigden | 841 | 46.0% | |
| Labour | J. Young | 820 | 44.8% | |
| SLD | D. Collins | 168 | 9.2% | |
| Turnout | 38.3% | |||
| Conservative gain from Labour | ||||
Latton Bush
| Party | Candidate | Votes | % | |
|---|---|---|---|---|
| Labour | A. Jones | 1,052 | 69.5% | |
| Conservative | S. Cross | 461 | 30.5% | |
| Turnout | 36.7% | |||
| Labour hold | ||||
Little Parndon

| Party | Candidate | Votes | % | |
|---|---|---|---|---|
| Labour | D. Condon | 975 | 65.0 | |
| Conservative | K. Smart | 355 | 23.7% | |
| SLD | L. Spenceley | 171 | 11.4% | |
| Labour hold | ||||
Mark Hall South

| Party | Candidate | Votes | % | |
|---|---|---|---|---|
| Labour | T. Farr | 1,061 | 69.7% | |
| Conservative | N. Hitch | 333 | 21.9% | |
| SLD | N. Armitage | 129 | 8.5% | |
| Turnout | 38.9% | |||
| Labour hold | ||||
Netteswell East

| Party | Candidate | Votes | % | |
|---|---|---|---|---|
| Labour | P. Balbi | 727 | 65.2% | |
| Conservative | M. Rigden | 260 | 23.3% | |
| SLD | V. Scott | 128 | 11.5% | |
| Turnout | 38.5% | |||
| Labour hold | ||||
Netteswell West

| Party | Candidate | Votes | % | |
|---|---|---|---|---|
| Labour | M. Coleman | 618 | 64.6% | |
| Conservative | S. Jones | 215 | 22.5% | |
| SLD | S. Herbert | 123 | 12.9% | |
| Turnout | 37.7% | |||
| Labour hold | ||||
Old Harlow

| Party | Candidate | Votes | % | |
|---|---|---|---|---|
| Labour | Richard Howitt | 1,243 | 48.7% | |
| Conservative | S. Carter | 1,151 | 45.1% | |
| SLD | P. Barton | 156 | 6.1% | |
| Turnout | 55.7% | |||
| Labour hold | ||||
Passmores

| Party | Candidate | Votes | % | |
|---|---|---|---|---|
| Labour | J. Rogers | 859 | 61.8% | |
| Conservative | M. Tombs | 381 | 27.4% | |
| SLD | A. Curran | 149 | 10.7% | |
| Turnout | 35.0% | |||
| Labour hold | ||||
Potter Street

| Party | Candidate | Votes | % | |
|---|---|---|---|---|
| Labour | R. Brown | 970 | 71.5% | |
| Conservative | D. Fleming | 244 | 18.0% | |
| SLD | S. Ward | 142 | 10.5% | |
| Turnout | 41.2% | |||
| Labour hold | ||||
Stewards
| Party | Candidate | Votes | % | |
|---|---|---|---|---|
| SLD | S. Curran | 750 | 50.7% | |
| Labour | C. Downing | 560 | 37.9% | |
| Conservative | K. Jones | 168 | 11.4% | |
| Turnout | 37.6% | |||
| SLD hold | ||||
Tye Green
| Party | Candidate | Votes | % | |
|---|---|---|---|---|
| Labour | V. Phelps | 1,044 | 76.5% | |
| Conservative | B. Hill | 321 | 23.5% | |
| Turnout | 36.9% | |||
| Labour hold | ||||
References
- ^ "Council compositions by year". The Elections Centre.
- ^ a b "Local Election Summaries 1988". The Elections Centre.
- ^ a b c d e f g h i j k l m n "Harlow District Council Election Results 1973-2012" (PDF). Elections Centre. Retrieved 27 September 2019.
- v
- t
- e
 Council elections in Essex
- See also: Wards
- Boundary changes
| |
|---|---|
| Metropolitan boroughs |
|
| District councils (England) |
|
| District councils (Scotland) |
|


