1989 United Kingdom local elections
 | |||||||||||||||||||||||||||||
All 39 non-metropolitan counties, 1 sui generis authority, all 26 Northern Irish districts and all 8 Welsh counties | |||||||||||||||||||||||||||||
|---|---|---|---|---|---|---|---|---|---|---|---|---|---|---|---|---|---|---|---|---|---|---|---|---|---|---|---|---|---|
| |||||||||||||||||||||||||||||
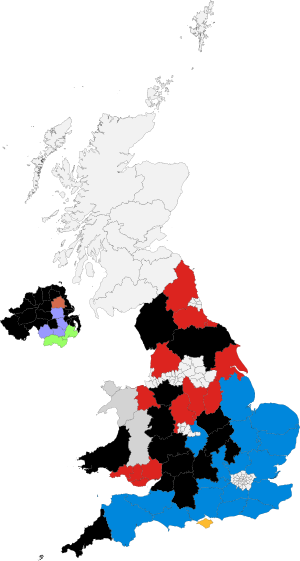 Colours denote the winning party, as shown in the main table of results. | |||||||||||||||||||||||||||||


The 1989 United Kingdom local elections were held on Thursday 4 May 1989 in England and Wales, and Wednesday 17 May 1989 in Northern Ireland.[1][2] The Labour Party had the highest projected national vote share, but the Conservative Party, in power at Westminster, gained the most seats. On the same day, there was a parliamentary by-election in the Vale of Glamorgan constituency in Wales; Labour won the seat from the Conservatives.
The national projected share of the vote was Labour 42%, Conservative 36%, Liberal Democrats 19%. The Conservatives gained 92 seats, Labour gained 35 seats and the Liberal Democrats lost 175 seats. It was Labour's largest share of the vote in any election in a decade, as the party's popularity continued to improve as a result of the ongoing modernisation process under Neil Kinnock, and that the Conservative government's popularity was starting to fall following the announcement of the poll tax.
Summary of results
England
Non-metropolitan county councils
| Council | Previous control | Result | Details | ||
|---|---|---|---|---|---|
| Avon | No overall control | No overall control hold | Details | ||
| Bedfordshire | No overall control | No overall control hold | Details | ||
| Berkshire | Conservative | Conservative hold | Details | ||
| Buckinghamshire | Conservative | Conservative hold | Details | ||
| Cambridgeshire | No overall control | Conservative gain | Details | ||
| Cheshire | No overall control | No overall control hold | Details | ||
| Cleveland | Labour | Labour hold | Details | ||
| Cornwall | No overall control | No overall control hold | Details | ||
| Cumbria | No overall control | No overall control hold | Details | ||
| Derbyshire | Labour | Labour hold | Details | ||
| Devon | No overall control | Conservative gain | Details | ||
| Dorset | Conservative | Conservative hold | Details | ||
| Durham | Labour | Labour hold | Details | ||
| East Sussex | No overall control | Conservative gain | Details | ||
| Essex | No overall control | Conservative gain | Details | ||
| Gloucestershire | No overall control | No overall control hold | Details | ||
| Hampshire | No overall control | Conservative gain | Details | ||
| Hereford and Worcester | Conservative | No overall control gain | Details | ||
| Hertfordshire | No overall control | Conservative gain | Details | ||
| Humberside | No overall control | Labour gain | Details | ||
| Isle of Wight | SLD | SLD hold | Details | ||
| Kent | Conservative | Conservative hold | Details | ||
| Lancashire | No overall control | Labour gain | Details | ||
| Leicestershire | No overall control | No overall control hold | Details | ||
| Lincolnshire | Conservative | Conservative hold | Details | ||
| Norfolk | Conservative | Conservative hold | Details | ||
| North Yorkshire | No overall control | No overall control hold | Details | ||
| Northamptonshire | No overall control | No overall control hold | Details | ||
| Northumberland | No overall control | Labour gain | Details | ||
| Nottinghamshire | Labour | Labour hold | Details | ||
| Oxfordshire | No overall control | No overall control hold | Details | ||
| Shropshire | No overall control | No overall control hold | Details | ||
| Somerset | No overall control | Conservative gain | Details | ||
| Staffordshire | Labour | Labour hold | Details | ||
| Suffolk | Conservative | Conservative hold | Details | ||
| Surrey | Conservative | Conservative hold | Details | ||
| Warwickshire | No overall control | Conservative gain | Details | ||
| West Sussex | Conservative | Conservative hold | Details | ||
| Wiltshire | No overall control | No overall control hold | Details | ||
Sui generis
| Council | Previous control | Result | Details | ||
|---|---|---|---|---|---|
| Isles of Scilly | Details | ||||
Northern Ireland
Wales
County councils
| Council | Previous control | Result | Details | ||
|---|---|---|---|---|---|
| Clwyd | No overall control | Labour gain | Details | ||
| Dyfed | No overall control | No overall control hold | Details | ||
| Gwent | Labour | Labour hold | Details | ||
| Gwynedd | Independent | Independent hold | Details | ||
| Mid Glamorgan | Labour | Labour hold | Details | ||
| Powys | Independent | Independent hold | Details | ||
| South Glamorgan | Labour | Labour hold | Details | ||
| West Glamorgan | Labour | Labour hold | Details | ||
References
- Local elections 2006. House of Commons Library Research Paper 06/26.
- Vote 2001 BBC News
- v
- t
- e

(England)
- Avon
- Bedfordshire
- Berkshire
- Buckinghamshire
- Cambridgeshire
- Cheshire
- Cleveland
- Cornwall
- Cumbria
- Derbyshire
- Devon
- Dorset
- Durham
- East Sussex
- Essex
- Gloucestershire
- Hampshire
- Hereford and Worcester
- Hertfordshire
- Humberside
- Isle of Wight
- Kent
- Lancashire
- Leicestershire
- Lincolnshire
- Norfolk
- North Yorkshire
- Northamptonshire
- Northumberland
- Nottinghamshire
- Oxfordshire
- Shropshire
- Somerset
- Staffordshire
- Suffolk
- Surrey
- Warwickshire
- West Sussex
- Wiltshire
- Clwyd
- Dyfed
- Gwent
- Gwynedd
- Mid Glamorgan
- Powys
- South Glamorgan
- West Glamorgan
(Northern Ireland)
- Isles of Scilly
- See also: European Parliament election


