Local Elections in England
2022 Maidstone Borough Council election
|
|
18 out of 55 seats to Maidstone Borough Council
28 seats needed for a majority |
|---|
| | First party | Second party | Third party | | |  | | | | Party | Conservative | Liberal Democrats | Independent | | Last election | 29 seats, 47.3% | 12 seats, 19.5% | 10 seats, 5.2% | | Seats won | 7 | 6 | 1 | | Seats after | 27 | 12 | 10 | | Seat change |  2 2 |  | | | Popular vote | 12,180 | 7,984 | 1,892 | | Percentage | 38.6% | 25.3% | 6.0% | | Swing | 8.7% |  5.8% 5.8% | 0.8% |
| | | Fourth party | Fifth party | | | | | | Party | Labour | Green | | Last election | 4 seats, 14.1% | 0 seats, 13.4% | | Seats won | 3 | 1 | | Seats after | 5 | 1 | | Seat change | 1 | 1 | | Popular vote | 4,861 | 4,501 | | Percentage | 15.4% | 14.3% | | Swing | 1.3% | 0.9% | |
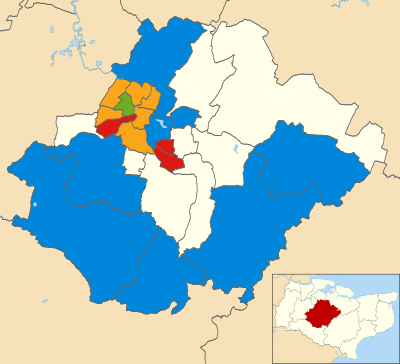 Winner of each seat at the 2022 Maidstone Borough Council election |
Council control before election
Conservative
| Council control after election
Conservative
| |
The 2022 Maidstone Borough Council election took place on 5 May 2022, in order to elect 18 out of 55 members to the Maidstone Borough Council. These set of seats were last up for election in 2018. Members elected in this election will have their seats next up for election in 2024, due to the council opting for a four-year cycle of elections instead of the current format from 2024 onwards.
As the results were declared, the Conservative Party initially lost their majority on the council:[1]
| Before 2022 election | After 2022 election |
| Party | Seats | Party | Seats |
| | Conservative | 29 | | Conservative | 27 |
| | Liberal Democrats | 12 | | Liberal Democrats | 12 |
| | Labour | 4 | | Labour | 5 |
| | Green | 0 | | Green | 1 |
| | Independent | 10 | | Independent | 10 |
After the result was declared, but before the first post-election meeting of the council, independent councillor Nick de Wiggondene-Sheppard rejoined the Conservatives (having been elected as a Conservative in 2019 but subsequently left the party). This meant that the Conservatives managed to retain a one seat majority on the council at the annual council meeting on 21 May 2022, retaining control of the authority.[2]
Results summary
| 2022 Maidstone Borough Council election |
| Party | This election | Full council | This election |
| Seats | Net | Seats % | Other | Total | Total % | Votes | Votes % | +/− |
| | Conservative | 7 | 2 | 38.9 | 20 | 27 | 49.1 | 12,180 | 38.6 | -8.7 |
| | Liberal Democrats | 6 | | 33.3 | 6 | 12 | 21.8 | 7,984 | 25.3 | +5.8 |
| | Independent | 1 | | 5.6 | 9 | 10 | 18.2 | 1,892 | 6.0 | +0.8 |
| | Labour | 3 | 1 | 16.7 | 2 | 5 | 9.1 | 4,861 | 15.4 | +1.3 |
| | Green | 1 | 1 | 5.6 | 0 | 1 | 1.8 | 4,501 | 14.3 | +0.9 |
| | British Democrats | 0 | | 0.0 | 0 | 0 | 0.0 | 117 | 0.4 | N/A |
Ward results
Allington
Allington | Party | Candidate | Votes | % | ±% |
| | Liberal Democrats | Thomas Wilkinson | 1,082 | 46.9 | -11.1 |
| | Conservative | Eve Burton | 870 | 37.7 | +12.9 |
| | Labour | John Randall | 200 | 8.7 | +0.9 |
| | Green | Ian Stewart | 155 | 6.7 | -2.6 |
| Majority | 212 | 9.2 | |
| Turnout | 2,317 | | |
| | Liberal Democrats hold | Swing | 12.0 | |
Bearsted
Bearsted | Party | Candidate | Votes | % | ±% |
| | Conservative | Sandra Knatchbull | 1,373 | 57.5 | -9.2 |
| | Liberal Democrats | Ian Chittenden | 563 | 23.6 | +6.5 |
| | Green | Ciaran Oliver | 450 | 18.9 | +2.8 |
| Majority | 810 | 15.7 | |
| Turnout | 2,396 | | |
| | Conservative hold | Swing | 7.9 | |
Boxley
Boxley | Party | Candidate | Votes | % | ±% |
| | Conservative | Bob Hinder | 1,194 | 59.4 | +0.4 |
| | Liberal Democrats | Michael Thompson | 577 | 28.7 | +4.5 |
| | Green | Susan Parr | 239 | 11.9 | N/A |
| Majority | 617 | 30.7 | |
| Turnout | 2,022 | | |
| | Conservative hold | Swing | 2.1 | |
Bridge
Bridge | Party | Candidate | Votes | % | ±% |
| | Green | Stuart Jeffery | 820 | 50.1 | +19.2 |
| | Conservative | Mitu Chowdhury | 483 | 29.5 | -12.9 |
| | Liberal Democrats | Chris Passmore | 178 | 10.9 | -15.9 |
| | Labour | David Reay | 157 | 9.6 | N/A |
| Majority | 337 | 20.6 | |
| Turnout | 1,642 | | |
| | Green gain from Conservative | Swing | 16.1 | |
Coxheath and Hunton
Coxheath and Hunton | Party | Candidate | Votes | % | ±% |
| | Conservative | Lottie Parfitt-Reid | 1,078 | 52.6 | -6.3 |
| | Green | Claire Kehily | 507 | 24.7 | +7.9 |
| | Liberal Democrats | Simon Wales | 465 | 22.7 | -1.6 |
| Majority | 571 | 27.9 | |
| Turnout | 2,066 | | |
| | Conservative hold | Swing | 7.1 | |
East
East | Party | Candidate | Votes | % | ±% |
| | Liberal Democrats | Richard Conyard | 1,002 | 48.1 | +14.9 |
| | Conservative | James Reid | 593 | 28.5 | -4.0 |
| | Independent | Nikki Fissenden | 310 | 14.9 | N/A |
| | Green | Donna Greenan | 177 | 8.5 | +0.7 |
| Majority | 409 | 19.6 | |
| Turnout | 2,090 | | |
| | Liberal Democrats hold | Swing | 9.5 | |
Fant
Fant | Party | Candidate | Votes | % | ±% |
| | Labour | Paul Harper | 1,235 | 61.0 | +17.6 |
| | Conservative | Jaison Musindo | 379 | 18.7 | -16.2 |
| | Liberal Democrats | Julia Batt | 215 | 10.6 | N/A |
| | Green | Kimberley Milham | 196 | 9.7 | -11.9 |
| Majority | 856 | 42.3 | |
| Turnout | 2,043 | | |
| | Labour hold | Swing | 16.9 | |
Harrietsham and Lenham
Harrietsham and Lenham | Party | Candidate | Votes | % | ±% |
| | Independent | Janetta Sams | 1,439 | 77.1 | +19.6 |
| | Conservative | Sasha Luck | 427 | 22.9 | -10.2 |
| Majority | 1,012 | 54.2 | |
| Turnout | 1,876 | | |
| | Independent hold | Swing | 14.9 | |
Headcorn
Headcorn | Party | Candidate | Votes | % | ±% |
| | Conservative | Martin Round | 888 | 55.0 | -8.9 |
| | Green | Derek Eagle | 326 | 20.2 | +7.4 |
| | Labour | Sarah Barwick | 230 | 14.3 | +3.6 |
| | Liberal Democrats | Martin Richards | 170 | 10.5 | +0.7 |
| Majority | 562 | 34.8 | |
| Turnout | 1,630 | | |
| | Conservative hold | Swing | 8.2 | |
Heath
Heath | Party | Candidate | Votes | % | ±% |
| | Liberal Democrats | Ashleigh Kimmance | 530 | 36.1 | +1.7 |
| | Conservative | Angel Rai | 451 | 30.7 | -6.1 |
| | Labour | Derek Swan | 348 | 23.7 | +4.1 |
| | Green | Matthew White | 91 | 6.2 | -3.0 |
| | Independent | Gary Butler | 49 | 3.3 | N/A |
| Majority | 79 | 5.4 | |
| Turnout | 1,472 | | |
| | Liberal Democrats hold | Swing | 3.9 | |
High Street
High Street | Party | Candidate | Votes | % | ±% |
| | Liberal Democrats | Clive English | 733 | 42.6 | +5.2 |
| | Labour | Richard Coates | 375 | 21.8 | +1.9 |
| | Conservative | Dani Stephenson | 374 | 21.7 | -6.8 |
| | Green | Steven Cheeseman | 239 | 13.9 | -0.3 |
| Majority | 358 | 20.8 | |
| Turnout | 1,735 | | |
| | Liberal Democrats hold | Swing | 1.7 | |
Marden and Yalding
Marden and Yalding | Party | Candidate | Votes | % | ±% |
| | Conservative | David Burton | 1,220 | 53.9 | -7.8 |
| | Green | Mick Summersgill | 595 | 26.3 | +8.0 |
| | Labour | Alwyn Whitlock | 450 | 19.9 | +8.5 |
| Majority | 625 | 27.6 | |
| Turnout | 2,283 | | |
| | Conservative hold | Swing | 7.9 | |
North
North | Party | Candidate | Votes | % | ±% |
| | Liberal Democrats | Tony Harwood | 971 | 51.4 | +11.2 |
| | Conservative | Scott Hahnefeld | 487 | 25.8 | -11.1 |
| | Labour | Jo Burns | 292 | 15.5 | +3.0 |
| | Green | Stephen Thompson | 139 | 7.4 | -3.0 |
| Majority | 484 | 22.4 | |
| Turnout | 1,900 | | |
| | Liberal Democrats hold | Swing | 11.2 | |
Park Wood
Park Wood | Party | Candidate | Votes | % | ±% |
| | Labour | Dan Wilkinson | 532 | 45.4 | +7.2 |
| | Conservative | Jaime Graymead | 432 | 36.8 | -15.5 |
| | Green | Caroline Jessel | 113 | 9.6 | N/A |
| | Liberal Democrats | Rob Field | 96 | 8.2 | -1.3 |
| Majority | 100 | 8.6 | |
| Turnout | 1,181 | | |
| | Labour gain from Conservative | Swing | 11.4 | |
Shepway North
Shepway North | Party | Candidate | Votes | % | ±% |
| | Conservative | Alan Bartlett | 653 | 40.4 | -10.9 |
| | Labour | Henry Morgan | 389 | 24.0 | +5.8 |
| | Liberal Democrats | Joe Higson | 350 | 21.6 | +5.8 |
| | Green | Stephen Muggeridge | 132 | 8.2 | -0.9 |
| | Independent | Melanie Butler | 94 | 5.8 | +0.3 |
| Majority | 264 | 16.4 | |
| Turnout | 1,622 | | |
| | Conservative hold | Swing | 8.4 | |
Shepway South
Shepway South | Party | Candidate | Votes | % | ±% |
| | Labour | Maureen Cleator | 341 | 39.8 | +17.7 |
| | Conservative | John Barned | 333 | 38.9 | -0.5 |
| | British Democrats | Lawrence Rustem | 117 | 13.7 | N/A |
| | Liberal Democrats | Geoff Samme | 65 | 7.6 | -0.2 |
| Majority | 8 | 0.9 | |
| Turnout | 858 | | |
| | Labour hold | Swing | 9.1 | |
South
South | Party | Candidate | Votes | % | ±% |
| | Liberal Democrats | Derek Mortimer | 1,083 | 48.0 | +5.2 |
| | Conservative | Paul Thomas | 780 | 34.6 | -5.0 |
| | Labour | Marlyn Randall | 212 | 9.4 | +0.3 |
| | Green | Simon Milham | 180 | 8.0 | -0.4 |
| Majority | 303 | 13.4 | |
| Turnout | 2,265 | | |
| | Liberal Democrats hold | Swing | 5.1 | |
Staplehurst
Staplehurst | Party | Candidate | Votes | % | ±% |
| | Conservative | John Perry | 818 | 48.0 | -7.1 |
| | Labour | Rory Silkin | 632 | 37.1 | +26.2 |
| | Green | Meg Shepherd-Foster | 255 | 15.0 | +3.6 |
| Majority | 186 | 10.9 | |
| Turnout | 1,724 | | |
| | Conservative hold | Swing | 16.7 | |
References
- ^ "Maidstone election result". BBC News. BBC. 6 May 2022. Retrieved 6 May 2022.
- ^ Smith, Alan (10 May 2022). "Conservatives back in charge at Maidstone council after Independent rejoins the party". Kent Online. Retrieved 26 July 2022.


 2
2 
 1
1  Council elections in Kent


