Local government elections in Hertfordshire, England
One third of Broxbourne Borough Council in Hertfordshire, England is elected each year, followed by one year without election. Since the last boundary changes in 2012, 30 councillors are elected from 10 wards.[1]
Council elections
Political balance of the council
| Election Year | Conservative | Labour | Liberal | SDP-Liberal Alliance | Liberal Democrats | British National Party | Independent | Total |
| 1973 | 28 | 12 | 0 | 0 | 0 | 0 | 0 | 40 |
| 1976 | 36 | 6 | 0 | 0 | 0 | 0 | 0 | 42 |
| 1978 | 37 | 5 | 0 | 0 | 0 | 0 | 0 | 42 |
| 1979 | 37 | 5 | 0 | 0 | 0 | 0 | 0 | 42 |
| 1980 | 34 | 7 | 1 | 0 | 0 | 0 | 0 | 42 |
| 1982 | 33 | 7 | 0 | 2 | 0 | 0 | 0 | 42 |
| 1983 | 32 | 6 | 0 | 4 | 0 | 0 | 0 | 42 |
| 1984 | 33 | 5 | 0 | 4 | 0 | 0 | 0 | 42 |
| 1986 | 32 | 6 | 0 | 4 | 0 | 0 | 0 | 42 |
| 1987 | 34 | 6 | 0 | 2 | 0 | 0 | 0 | 42 |
| 1988 | 36 | 5 | 0 | 1 | 0 | 0 | 0 | 42 |
| 1990 | 35 | 6 | 0 | 0 | 1 | 0 | 0 | 42 |
| 1991 | 35 | 5 | 0 | 0 | 2 | 0 | 0 | 42 |
| 1992 | 36 | 4 | 0 | 0 | 2 | 0 | 0 | 42 |
| 1994 | 33 | 5 | 0 | 0 | 4 | 0 | 0 | 42 |
| 1995 | 27 | 11 | 0 | 0 | 4 | 0 | 0 | 42 |
| 1996 | 24 | 14 | 0 | 0 | 4 | 0 | 0 | 42 |
| 1998 | 31 | 11 | 0 | 0 | 0 | 0 | 0 | 42 |
| 1999 | 33 | 5 | 0 | 0 | 0 | 0 | 0 | 38 |
| 2000 | 35 | 3 | 0 | 0 | 0 | 0 | 0 | 38 |
| 2002 | 35 | 2 | 0 | 0 | 0 | 0 | 1 | 38 |
| 2003 | 34 | 2 | 0 | 0 | 0 | 1 | 1 | 38 |
| 2004 | 34 | 2 | 0 | 0 | 0 | 1 | 1 | 38 |
| 2006 | 35 | 2 | 0 | 0 | 0 | 1 | 0 | 38 |
| 2007 | 36 | 2 | 0 | 0 | 0 | 0 | 0 | 38 |
| 2008 | 35 | 3 | 0 | 0 | 0 | 0 | 0 | 38 |
| 2010 | 35 | 3 | 0 | 0 | 0 | 0 | 0 | 38 |
| 2011 | 35 | 3 | 0 | 0 | 0 | 0 | 0 | 38 |
| 2012 | 27 | 3 | 0 | 0 | 0 | 0 | 0 | 30 |
| 2014 | 27 | 3 | 0 | 0 | 0 | 0 | 0 | 30 |
| 2015 | 27 | 3 | 0 | 0 | 0 | 0 | 0 | 30 |
| 2016 | 27 | 3 | 0 | 0 | 0 | 0 | 0 | 30 |
| 2018 | 28 | 2 | 0 | 0 | 0 | 0 | 0 | 30 |
| 2019 | 27 | 3 | 0 | 0 | 0 | 0 | 0 | 30 |
| 2021 | 27 | 3 | 0 | 0 | 0 | 0 | 0 | 30 |
| 2022 | 27 | 3 | 0 | 0 | 0 | 0 | 0 | 30 |
| 2023 | 27 | 3 | 0 | 0 | 0 | 0 | 0 | 30 |
[8]
Results maps
-
2012 results map
-
2014 results map
-
2015 results map
-
2016 results map
-
2018 results map
-
2019 results map
-
2021 results map
-
2022 results map
-
2023 results map
By-election results
1982-1986
Hoddesdon Town By-Election 3 March 1983 | Party | Candidate | Votes | % | ±% |
| | Alliance | Julian Gould | 1,060 | 51.86 | |
| | Conservative | Charles Thompson | 755 | 36.94 | |
| | Labour | Janet Batsleer | 229 | 11.20 | |
| Majority | 305 | | |
| Turnout | 2,044 | 44.80 | |
| | Alliance hold | Swing | | |
Wormley / Turnford By-Election 8 November 1984 | Party | Candidate | Votes | % | ±% |
| | Conservative | Beryl Poole | 470 | 50.92 | |
| | Labour | Mark Farrington | 302 | 32.72 | |
| | Alliance | Julie Cooper | 151 | 16.36 | |
| Majority | 168 | | |
| Turnout | 923 | 21.80 | |
| | Conservative hold | Swing | | |
Cheshunt Central By-Election 4 July 1985 | Party | Candidate | Votes | % | ±% |
| | Conservative | Graham Brewster | 535 | 43.50 | |
| | Alliance | Peter Huse | 468 | 38.05 | |
| | Labour | Mark Bryant | 227 | 18.45 | |
| Majority | 67 | | |
| Turnout | 1,230 | 33.80 | |
| | Conservative hold | Swing | | |
Rosedale By-Election 4 July 1985 | Party | Candidate | Votes | % | ±% |
| | Alliance | David Lefley | 372 | 40.83 | |
| | Conservative | Michael Lavender | 292 | 32.06 | |
| | Labour | Mark Farrington | 247 | 27.11 | |
| Majority | 80 | | |
| Turnout | 911 | 38.50 | |
| | Alliance hold | Swing | | |
Flamstead End By-Election 21 November 1985 | Party | Candidate | Votes | % | ±% |
| | Conservative | Gordon Greenwood | 511 | 48.44 | |
| | Alliance | Malcolm Aitken | 349 | 33.08 | |
| | Labour | Paul Spychal | 195 | 18.48 | |
| Majority | 162 | | |
| Turnout | 1,055 | 23.10 | |
| | Conservative hold | Swing | | |
1986-1990
Theobalds By-Election 29 October 1987 | Party | Candidate | Votes | % | ±% |
| | Conservative | Victor Bellingham | 427 | 54.75 | |
| | Labour | Lester Hicking | 254 | 32.56 | |
| | SLD | Kenneth King | 99 | 12.69 | |
| Majority | 173 | | |
| Turnout | 780 | 18.70 | |
| | Conservative hold | Swing | | |
Theobalds By-Election 4 May 1989 | Party | Candidate | Votes | % | ±% |
| | Conservative | Patricia Morris | 753 | 52.15 | |
| | Labour | Lester Hicking | 522 | 36.15 | |
| | SLD | Paul Seeby | 169 | 11.70 | |
| Majority | 231 | 34.90 | |
| Turnout | 1,444 | 36.40 | |
| | Conservative hold | Swing | | |
Waltham Cross North By-Election 4 May 1989 | Party | Candidate | Votes | % | ±% |
| | Conservative | Mandy Hayward | 587 | 51.99 | |
| | Labour | Malcolm Theobald | 416 | 36.85 | |
| | SLD | Anthony Stokes | 126 | 11.16 | |
| Majority | 171 | | |
| Turnout | 1,129 | 36.40 | |
| | Conservative hold | Swing | | |
1994-1998
Waltham Cross North By-Election 1 May 1997 | Party | Candidate | Votes | % | ±% |
| | Conservative | Charles Tranham | 1,055 | 49.4 | -7.0 |
| | Labour | Alan McCole | 888 | 41.6 | +3.8 |
| | Liberal Democrats | Jacqueline Barton | 192 | 9.0 | +3.2 |
| Majority | 167 | 7.8 | |
| Turnout | 2,135 | | |
| | Conservative gain from Labour | Swing | | |
1998-2002
Goffs Oak By-Election 9 July 1998 | Party | Candidate | Votes | % | ±% |
| | Conservative | Jacqueline De Pace | 569 | 75.0 | +3.3 |
| | Labour | Linda Dambrauskas | 131 | 17.2 | +4.4 |
| | Liberal Democrats | Jacqueline Barton | 42 | 5.5 | -1.7 |
| | Independent Conservative | Christopher Stone | 17 | 2.2 | -6.1 |
| Majority | 438 | 57.8 | |
| Turnout | 759 | | |
| | Conservative hold | Swing | | |
Cheshunt Central By-Election 16 November 2000 | Party | Candidate | Votes | % | ±% |
| | Conservative | Moyra O'Neill | 442 | 60.1 | +0.1 |
| | Labour | Carolyn Iles | 198 | 26.9 | +4.1 |
| | Liberal Democrats | Nicholas Garton | 54 | 7.3 | -3.0 |
| | BNP | John Cope | 42 | 5.7 | -1.3 |
| Majority | 244 | 33.2 | |
| Turnout | 736 | 12.9 | |
| | Conservative hold | Swing | | |
Theobalds By-Election 22 November 2001 | Party | Candidate | Votes | % | ±% |
| | Conservative | Alan Smith | 551 | 60.4 | -8.8 |
| | Labour | Richard Greenhill | 307 | 33.6 | +2.8 |
| | BNP | John Cope | 55 | 6.0 | +6.0 |
| Majority | 244 | 26.8 | |
| Turnout | 913 | 18.0 | |
| | Conservative hold | Swing | | |
2002-2006
Rosedale By-Election 5 May 2005 | Party | Candidate | Votes | % | ±% |
| | Conservative | David Lewis | 799 | 41.5 | |
| | BNP | Gary Horsley | 507 | 26.3 | |
| | Labour | Cherry Robbins | 426 | 22.1 | |
| | Liberal Democrats | Peter Huse | 193 | 10.0 | |
| Majority | 292 | 15.2 | |
| Turnout | 1,925 | 57.9 | |
| | Conservative hold | Swing | | |
2010-2014
Cheshunt Central By-Election 30 June 2011 | Party | Candidate | Votes | % | ±% |
| | Conservative | Tony Siracusa | 742 | 53.11 | |
| | Labour | Richard Greenhill | 481 | 34.43 | |
| | UKIP | David Platt | 88 | 6.30 | |
| | Independent | Joanne Welch | 62 | 4.44 | |
| | Liberal Democrats | Peter Huse | 24 | 1.72 | |
| Majority | 261 | | |
| Turnout | 1,397 | 24.80 | |
| | Conservative hold | Swing | | |
2014-2018
Waltham Cross by-Election 9 March 2017 | Party | Candidate | Votes | % | ±% |
| | Conservative | Patsy Spears | 650 | 41.0 | -3.5 |
| | Labour | Christian Durugo | 646 | 40.8 | -14.8 |
| | UKIP | Steve Coster | 200 | 12.6 | N/A |
| | Liberal Democrats | Brendan Wyer | 89 | 5.6 | N/A |
| Majority | 4 | 0.2 | |
| Turnout | | 20.85 | |
| | Conservative gain from Labour | Swing | | |
References
- ^ "Councillors". Borough of Broxbourne. Archived from the original on 3 July 2009. Retrieved 31 August 2009.
- ^ The Borough of Broxbourne (Electoral Arrangements) Order 1975
- ^ legislation.gov.uk - The Essex and Hertfordshire (County Boundaries) Order 1992. Retrieved on 5 November 2015.
- ^ legislation.gov.uk - The Essex, Greater London and Hertfordshire (County and London Borough Boundaries) Order 1993. Retrieved on 5 November 2015.
- ^ "Broxbourne". BBC News Online. Retrieved 31 August 2009.
- ^ legislation.gov.uk - The Borough of Broxbourne (Electoral Changes) Order 1998. Retrieved on 4 October 2015.
- ^ legislation.gov.uk - The Broxbourne (Electoral Changes) Order 2012. Retrieved on 3 November 2015.
- ^ "Borough of Broxbourne". Archived from the original on 3 July 2009. Retrieved 31 August 2009.
External links
- Broxbourne Borough Council
- Local Government Boundary Commission for England
 2012 results map
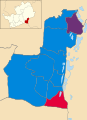 2014 results map

 Council elections in Hertfordshire


